
BLOG: Infrastruktur-Asset-Management
Indiana Jones and the Optimal Maintenance Strategy
Event-oriented maintenance, risk-based maintenance, condition-based maintenance, predictive maintenance, etc. In this jungle of maintenance strategies, some people easily lose sight of the big picture. What’s the best strategy to use? Is there an optimal maintenance strategy? Is there a Holy Grail of maintenance? Where is Indiana Jones when you need him? We don’t have him, but we do have the treasure map that will lead you to your maintenance optimum.
The Holy Grail of Maintenance
Actually, we have to ask ourselves: WHEN is maintenance optimal? You will surely smirk when I tell you: “It all depends”. You yourself know that cheaper isn’t always better. This, of course, also applies to maintenance. What benefit do you get from the last penny saved if your network is rundown? The costs for breakdowns and failures would skyrocket enormously. The other side of the coin is that more isn’t always merrier. With very high maintenance costs, you get a network that is perfectly maintained and is almost 100% reliable. But you also get a very expensive network. Somewhere between these two extremes lies the golden mean, the Holy Grail – the individual maintenance optimum. This relic isn’t just for Indiana Jones.
The Components of the Optimum
This optimum, the Holy Grail, is thus made up of two elements. On the one hand, there are simply the actual costs of maintenance and on the other, there are the risks, such as the risk of unavailability. This risk can have an impact on customer satisfaction, for example, and can be a bad PR for franchisors, politics, etc. The trick then lies in making risks measurable. But that goes beyond the scope of our topic here, so we’ll discuss it in another blog. In any case, you want to compare risks with maintenance costs. Then, for example, you can determine by how much your risk will increase if you save one euro in maintenance costs. That brings us very close to the Holy Grail – unless Indy has already snatched it away from us.
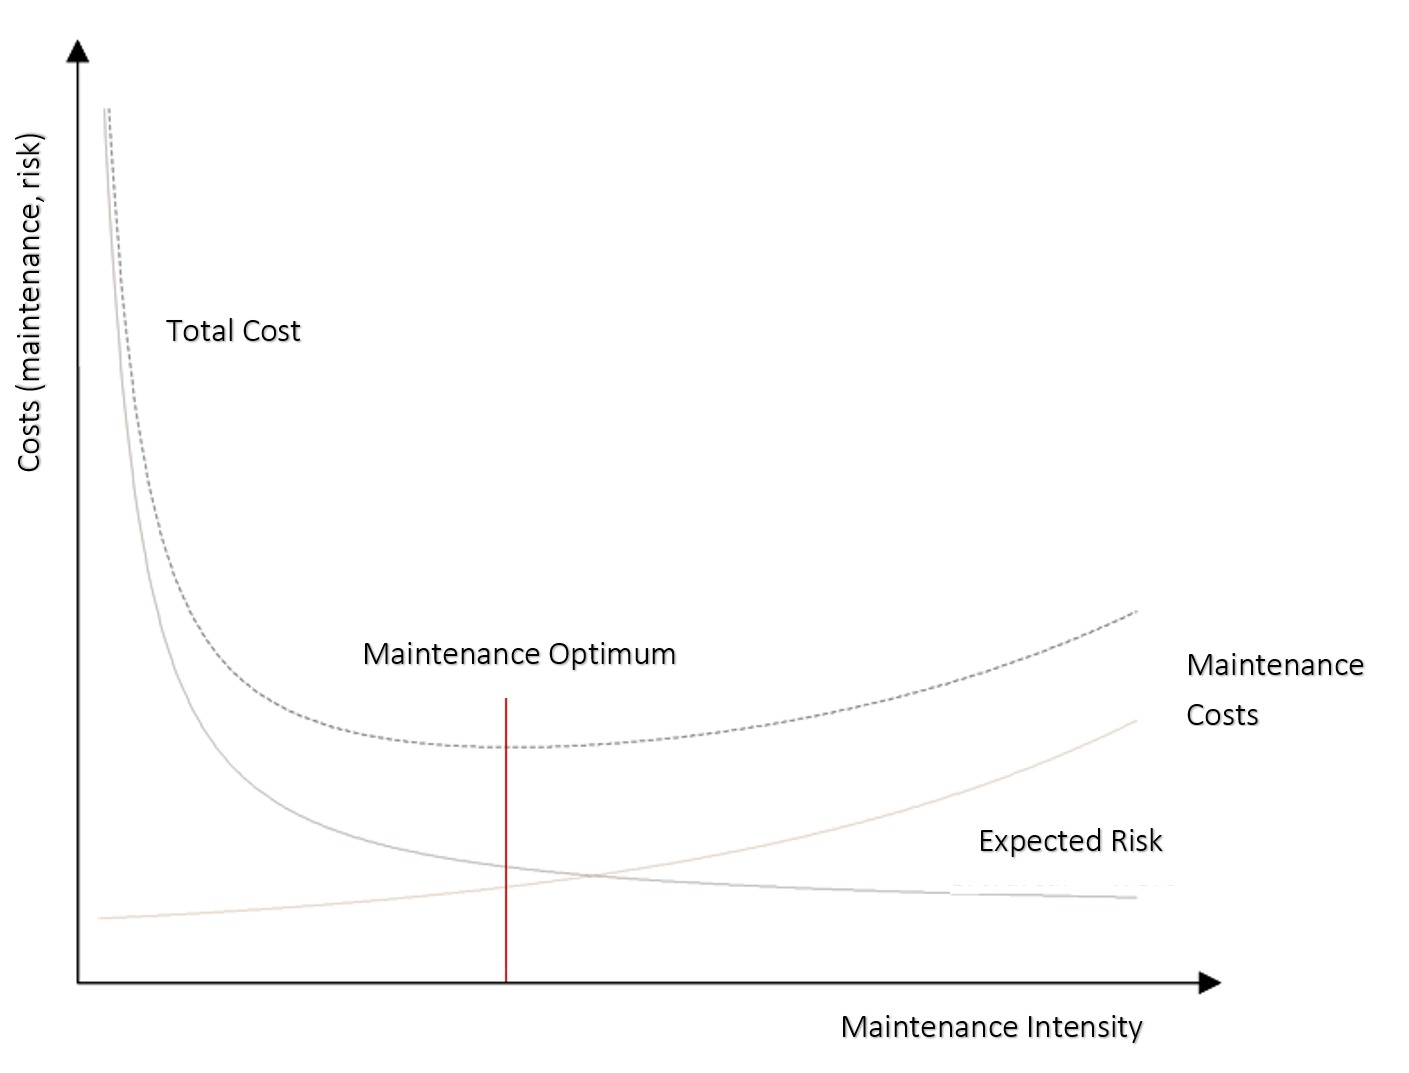
With a lot of imagination, you can spot the Holy Grail here. It is not as complicated as it may seem at first glance. The blue dashed curve represents the total cost of the optimal maintenance strategy for equipment or a portfolio of equipment. It is composed of the maintenance costs (curve rising to the right) and the expected values from the aggregated risks (curve falling to the right). The Y-axis indicates the costs in euros and the X-axis is the maintenance intensity, which indicates the extent and scope of maintenance activities on the network. It doesn’t take an advanced mathematics course to make it clear that the optimum is the minimum of the total cost curve. Maintenance is most effective where the total cost of the system is lowest. And we’re not just talking here about the pure costs of maintenance here. After all, you also want to know WHAT you inspect, maintain, repair and improve your system for.
The Maintenance Intensity
To determine this, you consider the quantified risks of your company in relation to the maintenance intensity. These are different for each network operator and can differ depending on the equipment. The goal of your company is to properly reconcile the expected risks with the costs. To illustrate, take a look at the following customer example.
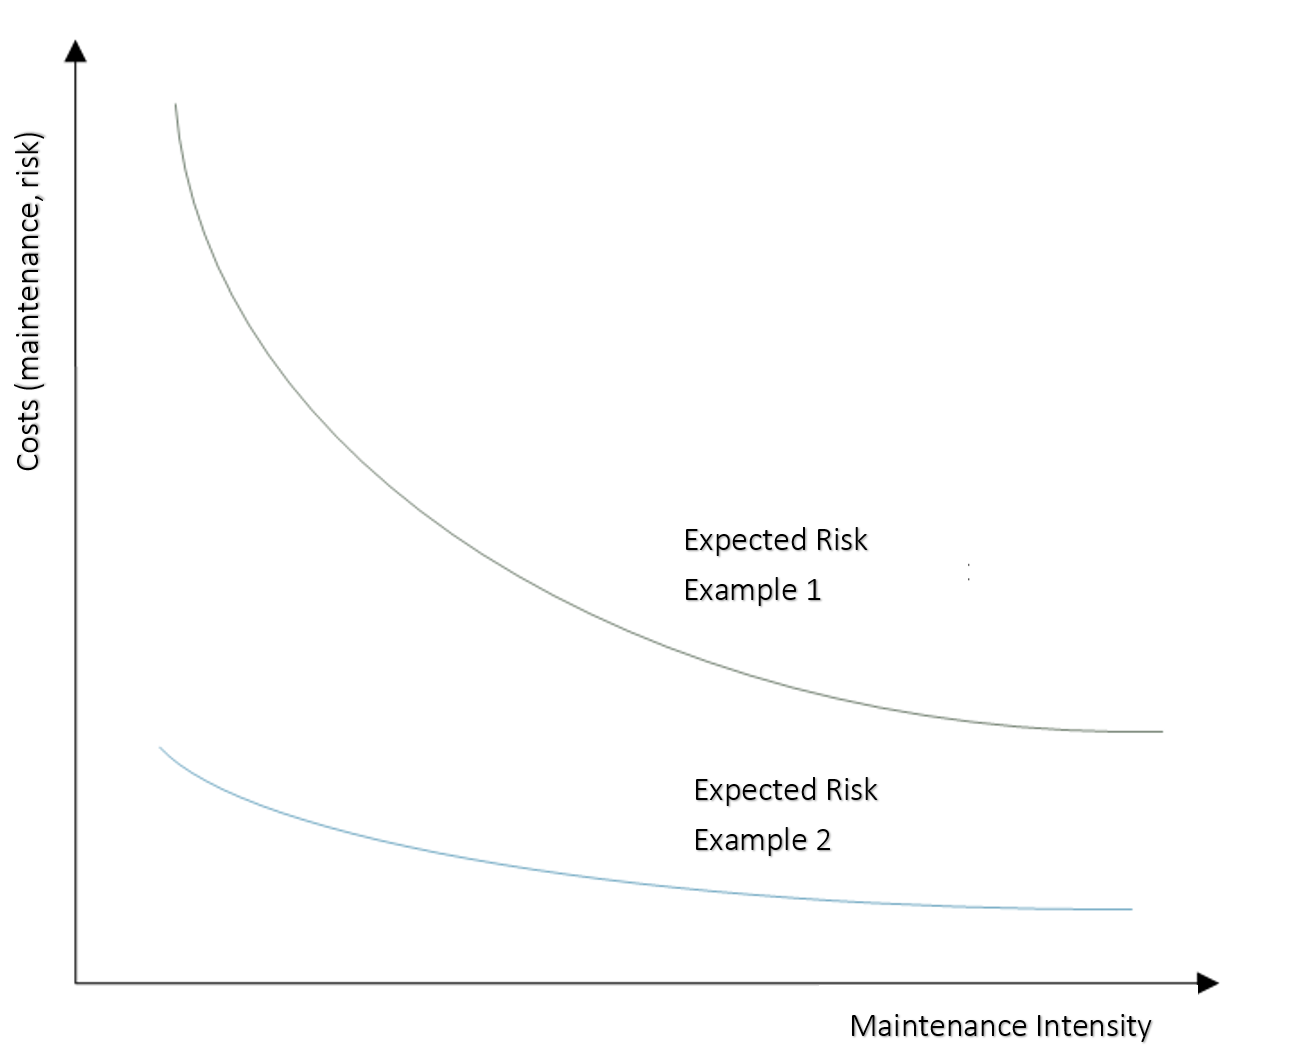
The first curve situated higher shows the costs of unavailability of an exemplary network operator who is on the verge of a licence renewal. The supply quality is highly rated here, which means that the curve is also steep in the upper-cost range and the slope. On the other hand, the second curve is comparatively lower and flatter because this network operator has fewer industrial consumers. In this example, the risk is classified lower.
The Risk to the Network
The risk is largely controlled by the intensity of maintenance. Sounds very scientific at first, but it’s not at all. The more or less money you put into your maintenance, the higher or lower the risk on the network. This is not a classic 1:1 relationship, as you can see in the following example.
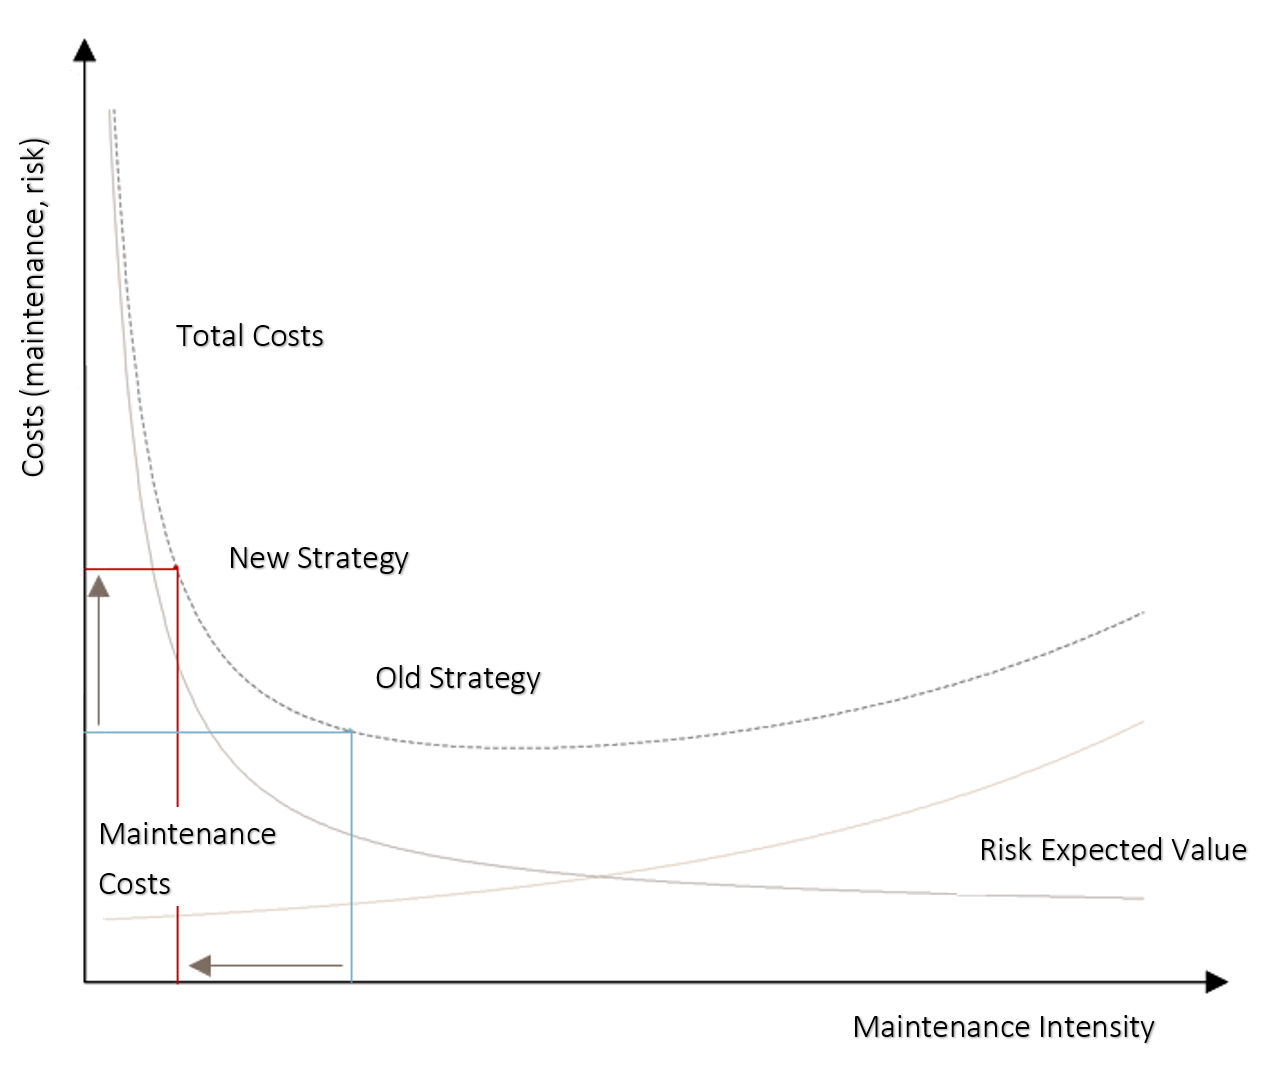
Here, the costs for equipment maintenance are reduced, which leads to a reduction of the intensity. Imagine that you are only carrying out maintenance in an event-oriented way instead of condition-based. This means that you spend almost nothing on preventive maintenance, but now have a higher risk to the network (e. g. due to unavailability). In this example, the savings in the maintenance area do not lead to the hoped-for savings, as more breakdowns and malfunctions occur. You should have stuck with condition-based maintenance. On the other hand, if you overdo it with maintenance, the opposite effect occurs.
Raiders of the Lost Ark
We are no keepers of the Grail and don’t hold back the secret until a hunter for lost treasure like Indiana Jones arrives. Basically, the way to the optimum is easy. First, you determine the most important assets for which you optimise maintenance. Then, you determine the corresponding maintenance strategies and the relevant risks for this asset portfolio. If you quantify the risks, you can determine the expected values for the aggregated risks. You can then determine your optimum maintenance through your personal balance of risks and costs. Since 2011, my company meliorate has assisted infrastructure owners and operators with these issues.
 FURTHER BLOG ENTRIES BY OLIVER D. FÖRSTER
Back to the Future: Predictive Maintenance
Maintenance? – We have always done it like that!
![]()
![]()